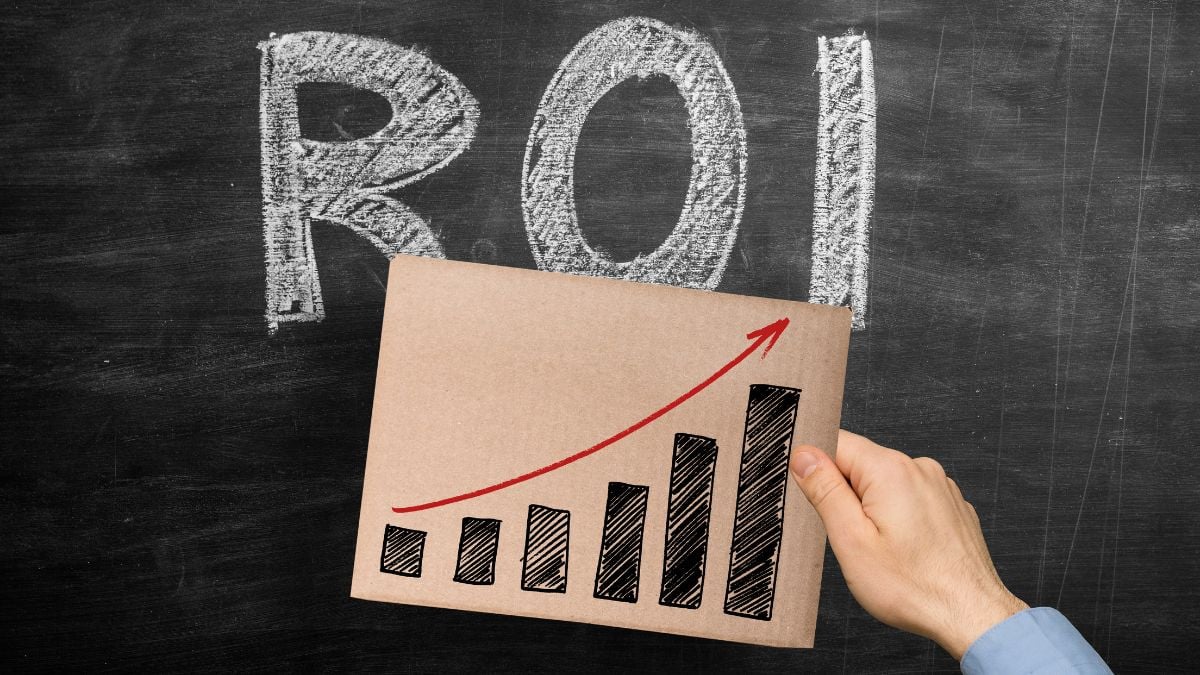
In every marketing investment and budget, knowing how much return each additional peso invested generates has become more important than ever. The The Effectiveness Equation report, developed by Google, introduces a key concept for present and future marketers: the ROI response curve.
This curve describes how return on investment behaves as marketing spend increases. Its shape is not linear, and understanding it allows for budget optimization, avoidance of media saturation, and maximization of each campaign’s impact.
Knowing where your campaign lies on that curve can help answer critical questions: Are you investing too little to see meaningful results? Are you at the peak of efficiency? Or are you already spending more than it’s worth?
ALSO READ.
How does the ROI response curve work?
The ROI response curve has a classic “S” (sigmoid) shape, divided into three fundamental stages:
- Low-efficiency zone (beginning of the curve): At this stage, the investment is so low that it barely generates any return. Campaigns may go unnoticed, fail to reach minimum frequency, or not gain enough traction.
- Accelerated performance zone (mid-growth): This is when spending begins to yield increasing returns. Critical media mass is reached, frequency is effective, and the message strongly hits the target audience.
- Saturation zone (diminishing returns): At this stage, adding more budget no longer brings proportional return. The message may begin to be ignored, or there’s simply no more room to scale without losing efficiency.
As the Google report points out, “spending more doesn’t always mean getting more.” That’s why identifying which part of the curve you’re operating in can make the difference between a profitable campaign and one that wastes resources.
What is marginal ROI and why is it more useful than total ROI?
One of the most valuable insights from the report is the distinction between Total ROI (TROI) and Marginal ROI (MROI):
- TROI (Total Return on Investment): measures the overall performance of a campaign relative to its total budget. It’s useful for assessing the broad impact.
- MROI (Marginal Return on Investment): measures the return generated by each additional peso invested. It’s key for incremental decision-making: Is it worth investing more?
While total ROI answers “Did my campaign work?”, marginal ROI addresses a more strategic question: “Should I scale this investment?”
How can you tell if you’re at the optimal point of your investment curve?
Identifying the optimal point on the ROI response curve involves cross-referencing performance data with investment levels over time and across different channels. There’s no single formula—contextual reading is essential.
Google’s report recommends using tools such as:
- Marketing Mix Modeling (MMM) to understand each channel’s contribution.
- Advanced attribution models to connect tactics with outcomes.
- A/B testing and incremental experiments to measure investment sensitivity.
With these tools, you can map your specific curve and determine whether you should increase, maintain, or reduce your budget.
What mistakes do brands make when interpreting ROI?
One common mistake is to interpret good total ROI as a signal to stop investing. This can be a false positive: often, a campaign shows strong overall performance, but its marginal ROI is still high, indicating there’s room to scale efficiently.
Another frequent mistake is failing to consider the “minimum investment threshold.” Some brands test channels with budgets so low that they don’t reach the critical mass needed to assess their true potential. They draw wrong conclusions like “that medium doesn’t work,” when in fact they never reached the productive part of the curve.
Brands also often ignore saturation, overspending in channels that have already hit peak efficiency. In that case, each additional peso yields little or no return and may even cause ad fatigue.
How does the ROI curve relate to brand building?
Google’s report emphasizes that brand marketing and performance marketing should not be evaluated the same way, but both follow their own ROI curves.
Brand marketing usually has a slower curve, with long-term results, but deep effects on loyalty, price elasticity, and perceived value. That’s why it’s key to apply measurement models that capture long-term return, such as CLTV (Customer Lifetime Value) or brand equity growth.
Meanwhile, performance marketing follows faster curves, which allow agile optimization—but also risk saturation if not complemented by brand efforts.
How can you make smart budgeting decisions based on the ROI curve?
The key is to avoid decisions based solely on historical results or generic allocation rules. Each campaign has a different performance curve, and each stage of a product or category’s lifecycle requires specific adjustments.
Google recommends fostering a “test & learn” culture that allows:
- Measuring marginal return by channel.
- Identifying the optimal investment point per segment.
- Reallocating budget in real-time based on data.
This way, instead of deciding whether to spend more or less, you can decide where, when, and how much more to invest to maximize total performance.
Are you maximizing your return or have you already hit the limit?
Understanding the ROI response curve is one of the most strategic moves a marketing team can make. It helps avoid extremes—neither overinvesting nor underinvesting—and operate at the sweet spot: where every peso invested multiplies its value.
In a fiercely competitive environment with limited budgets, knowing whether your campaign works isn’t enough: you need to know how much more it can yield before losing efficiency. Reading the ROI curve correctly is the new art of data-driven marketing.


